Fund Overview
An absolute return strategy that invests with the goals of capital preservation, achieving a return of 6-8% over cash and generating consistent benchmark relative alpha.
Strategy:
- Predominately long only portfolio which invests in structured credit securities and corporate bonds
- Investments include but are not limited to high quality residential mortgage-backed securities, commercial mortgage-backed securities, corporate debt, collateralized loan obligations, and other asset-backed lending products.
- The strategy generally invests with a cash cushion of between 10% – 15% to limit downside but also take advantage of opportunities that often appear within a short period of time.
- The fund has not used leverage to generate returns.
NAV - As of January. 31st, 2026
F Class (CAD) – REL600: $141.63 A Class (CAD) – REL200: $127.34 F Class (USD) – REL500: $137.29 F4 Class (CAD) – REL400: $117.45 F4 Class (USD) – REL700: $111.88
Mgmt. Fee
1.5%
Performance fee
0% < 5%
15% between 5% - 10%
20% > 10%
Sub-advisor
Astra Asset Management UK Ltd.

Shikha Gupta
Portfolio Manager and Investment Management Team member

Christian Adler
Co-Founder and Investment Management Team member
Eligibility
DRIP
Registered Accounts
Eligible
SWP
PACC
Fund Information
Inception Date: October 1, 2020
Administrator: SGGG Fund Services
Auditor: Goodman & Associates LLP
Strategy AUM: USD$657M
Canadian AUM: CAD$74M
Period Ending January 31st, 2026
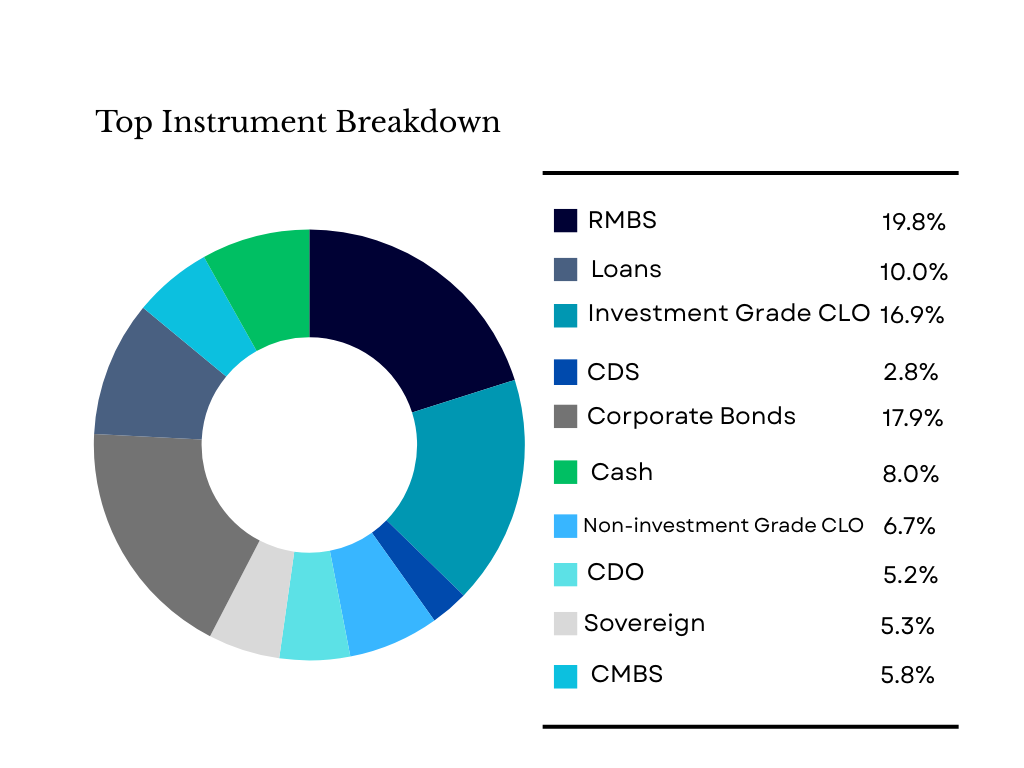
Sectors
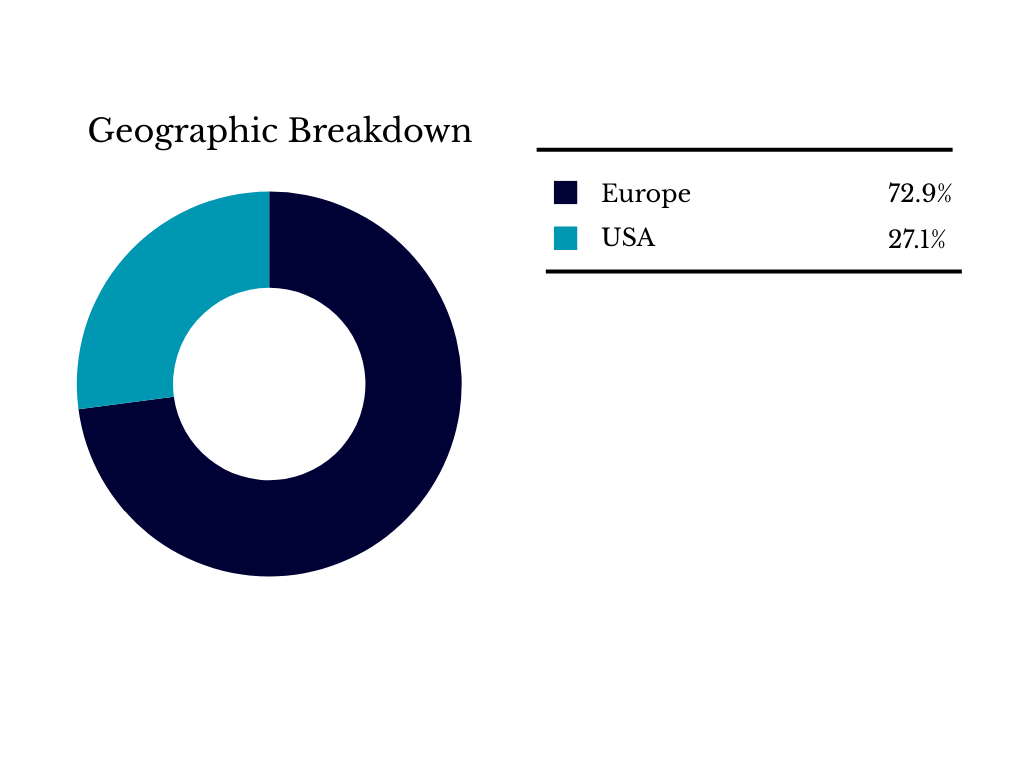
Region
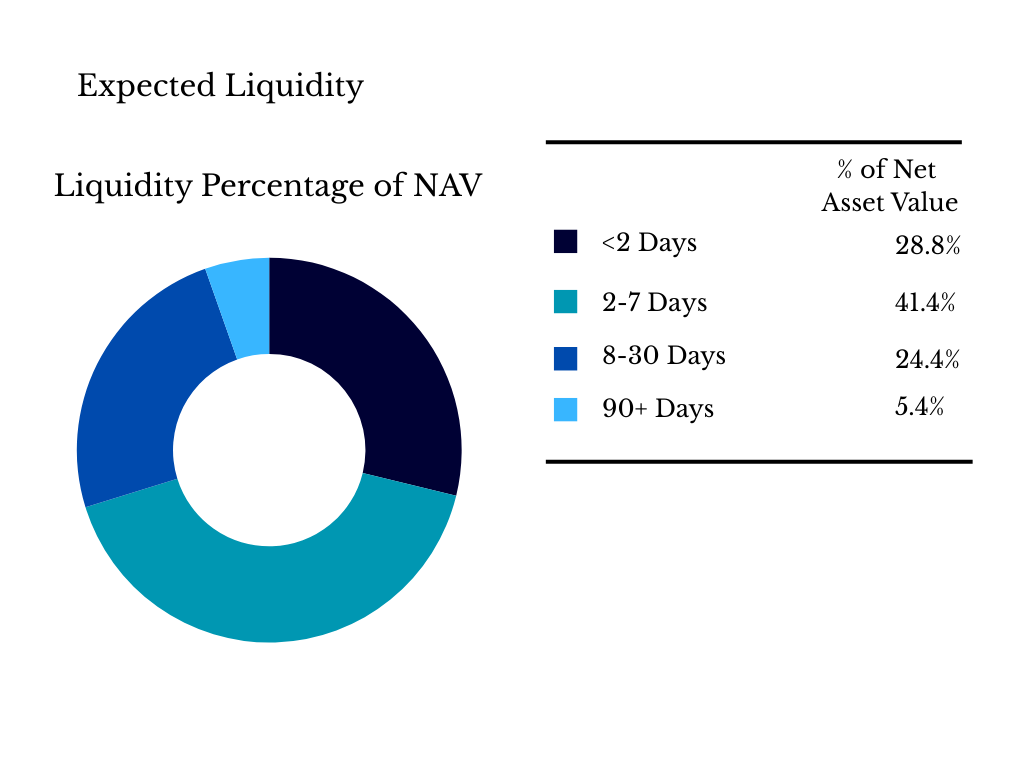
Liquidity
Relevance Diversified Credit CAD
Period Ending Jan. 31, 2026
| Particulars | 1 month | 3 months | 6 months | YTD | 1 year | 2 year | 3 year | 4 years | 5 years |
|---|---|---|---|---|---|---|---|---|---|
| Annualized Perf. | 0.25% | 2.08% | 3.74% | 0.25% | 7.30% | 9.02% | 8.42% | 6.30% | 6.81% |
| Standard Deviation | 2.36% | 2.28% | 3.37% | 5.24% | 4.77% |
| Year | Jan | Feb | March | April | May | June | July | Aug | Sept | Oct. | Nov. | Dec. | YTD |
|---|---|---|---|---|---|---|---|---|---|---|---|---|---|
| 2026 | 0.25% | 0.25% | |||||||||||
| 2025 | 0.82% | 0.41% | -0.36% | -0.21% | 1.02% | 0.47% | 2.08% | -0.07% | 0.78% | 0.91% | 0.32% | 1.50% | 7.90% |
| 2024 | 1.75% | 1.42% | 0.42% | 0.88% | 1.07% | 0.42% | 2.60% | 0.53% | 0.30% | 0.56% | 0.50% | 0.76% | 11.79% |
| 2023 | 2.52% | 0.32% | -3.62% | 1.21% | 0.78% | 1.28% | 1.43% | 0.92% | 0.28% | 1.14% | 1.85% | -0.22% | 8.04% |
| 2022 | -0.20% | -1.68% | 0.30% | -0.58% | -1.86% | -3.88% | 2.39% | 0.89% | -4.54% | 2.46% | 2.77% | 1.75% | -2.47% |
| 2021 | 0.60% | 0.73% | 0.22% | 0.53% | 0.58% | 0.90% | 0.24% | 0.14% | 0.20% | 2.00% | -0.21% | 0.72% | 6.84% |
| 2020 | 0.33% | 2.33% | 1.32% | 4.03% |
Relevance Diversified Credit USD
Period Ending Jan. 31, 2026
| Year | Jan | Feb | March | April | May | June | July | Aug | Sept | Oct. | Nov. | Dec. | YTD |
|---|---|---|---|---|---|---|---|---|---|---|---|---|---|
| 2026 | |||||||||||||
| 2025 | |||||||||||||
| 2024 | |||||||||||||
| 2023 | |||||||||||||
| 2022 | |||||||||||||
| 2021 | |||||||||||||
| 2020 |
- Monthly Newsletter - January 2026 - RDCF
- Monthly Newsletter - December 2025 - RDCF
- Monthly Newsletter - November 2025 - RDCF
- Monthly Newsletter - October 2025 - RDCF
- Monthly Newsletter - September 2025 - RDCF
- Monthly Newsletter - August 2025 - RDCF
- Monthly Newsletter - July 2025 - RDCF
- Monthly Newsletter - June 2025 - RDCF
- Monthly Newsletter - May 2025 - RDCF
- Monthly Newsletter - Apr 2025 - RDCF
- Monthly Newsletter - Mar 2025 - RDCF
- Monthly Newsletter - Feb 2025 - RDCF
- Past Monthly Newsletter - RDCF
- RDCF - Suscription Agreement
- RDCF - Offering Memorandum
- RDCF - December 31, 2023 - Financical Statements
| Particulars | Series | Currency | Fund Code | Mgmt. Fee | Performance Fee |
|---|---|---|---|---|---|
| Relevance Diversified Credit - Purchase | A | CAD | REL200P | 2% | 15/20 |
| Relevance Diversified Credit | A | CAD | REL200 | 2% | 15/20 |
| Relevance Diversified Credit - Purchase | F | CAD | REL600P | 1.5% | 15/20 |
| Relevance Diversified Credit | F | CAD | REL600 | 1.5% | 15/20 |
| Relevance Diversified Credit - Purchase | A | USD | REL300P | 2% | 15/20 |
| Relevance Diversified Credit | A | USD | REL300 | 2% | 15/20 |
| Relevance Diversified Credit - Purchase | F | USD | REL500P | 1.5% | 15/20 |
| Relevance Diversified Credit | F | USD | REL500 | 1.5% | 15/20 |
| Relevance Diversified Credit - Purchase | F4 | CAD | REL400P | 1.5% | 15/20 |
| Relevance Diversified Credit | F4 | CAD | REL400 | 1.5% | 15/20 |
| Relevance Diversified Credit - Purchase | F4 | USD | REL700P | 1.5% | 15/20 |
| Relevance Diversified Credit | F4 | USD | REL700 | 1.5% | 15/20 |
| Subscriptions | Monthly | |||
| Subscription Date | T + 2 | |||
| Redemptions | Monthly - 30 days notice | |||
| High Water Mark | 5% / 10% | |||
Corton Capital Inc. acts as Investment Fund Manager and Portfolio Manager of the Relevance Diversified Credit Fund and facilitates onboarding and investing in the Fund.
Investing in the Relevance Diversified Credit Fund is possible through one of the following methods:
Investing directly into the fund – Accredited Investors only
Investing through a retail broker
Investing through a Separately Managed Account – Corton Capital will set up an SMA account with NBIN – National Bank’s institutional broker-dealer subsidiary
For more information please visit Corton Capital’s website https://cortoncapitalinc.ca/
Commissions, trailing commissions, management fees and expenses all may be associated with investment fund investments. The prospectus contains important detailed information about the investment fund. Please read the prospectus before investing. There is no assurance that any fund will achieve its investment objective, and its net asset value, yield, and investment return will fluctuate from time to time with market conditions. Investment funds are not guaranteed, their values change frequently, and past performance may not be repeated. The indicated rate of return is the historical annual compounded total return including changes in share/unit value and reinvestment of all distributions and does not take into account sales, redemption, distribution or optional charges or income taxes payable by any securityholder that would have reduced returns.
This information is provided for illustrative and discussion purposes only. This material is not intended as a formal research report and should not be relied upon as a basis for making an investment decision. Historical trends do not imply, forecast or guarantee future results. Information is as of the date indicated and subject to change without notice. Nothing herein constitutes a prediction or projection of future events or future market behavior.
If the securities are purchased or sold on a stock exchange, you may pay more or receive less than the current net asset value. Investment funds are not guaranteed, their values change frequently and past performance may not be repeated.