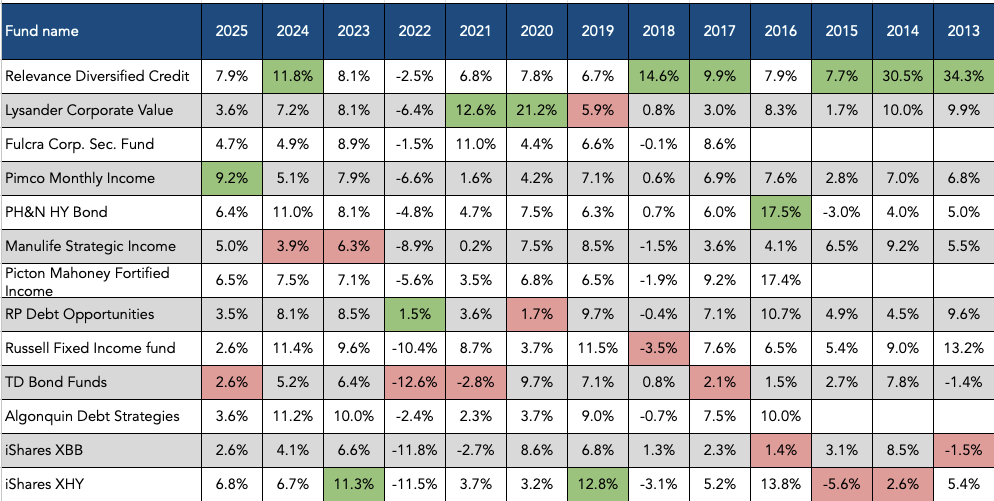
Relevance Diversified Credit
Period Ending January 31, 2026
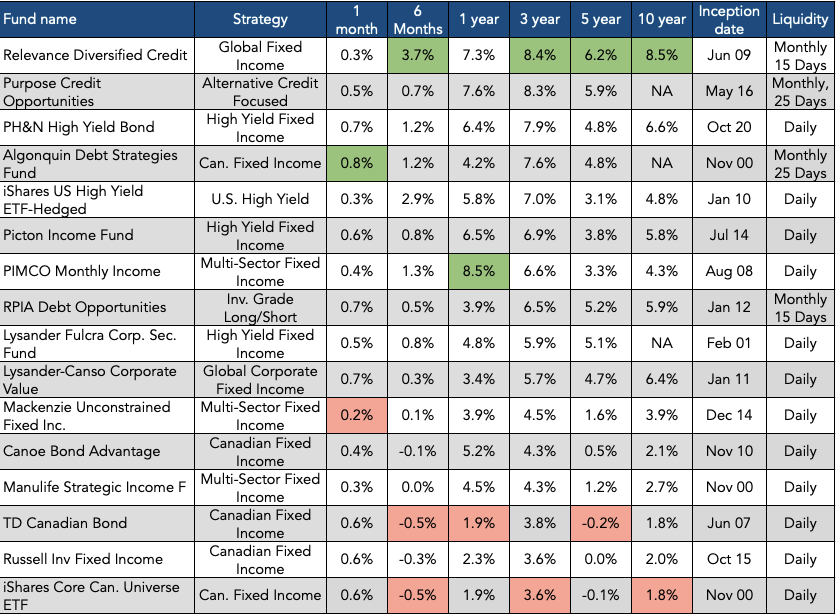
1Returns for 5, 10 year results are quoted for the Astra Specialist Credit fund which is the underlying fund to the Relevance Diversified Credit Fund.
2The since inception return for the Algonquin Debt Securities Fund is quote for the X Series. All other returns are quoted for the F Series.
Commissions, trailing commissions, management fees and expenses all may be associated with investment fund investments. The prospectus contains important detailed information about the investment fund. Please read the prospectus before investing. There is no assurance that any fund will achieve its investment objective, and its net asset value, yield, and investment return will fluctuate from time to time with market conditions. Investment funds are not guaranteed, their values change frequently, and past performance may not be repeated. The indicated rate of return is the historical annual compounded total return including changes in share/unit value and reinvestment of all distributions and does not take into account sales, redemption, distribution or optional charges or income taxes payable by any securityholder that would have reduced returns.
This information is provided for illustrative and discussion purposes only. This material is not intended as a formal research report and should not be relied upon as a basis for making an investment decision. Historical trends do not imply, forecast or guarantee future results. Information is as of the date indicated and subject to change without notice. Nothing herein constitutes a prediction or projection of future events or future market behavior.
If the securities are purchased or sold on a stock exchange, you may pay more or receive less than the current net asset value. Investment funds are not guaranteed, their values change frequently and past performance may not be repeated.